BGP Poisoning for AS-Level Mapping
Introduction
The Internet has come a long way from being just a few interconnected machines to a behemoth of billions of devices spread across the globe. It comprises independently operated networks called Autonomous Systems (AS), which operate based on their policies. These ASes interact with each other by forming direct connections with other ASes to collectively carry out traffic across the Internet or through common physical locations used to exchange data called Internet Exchange Points (IXPs). These connections are established using a Border Gateway Protocol (BGP), which operates on the principle of ASes establishing links with their neighbors. The nature of these links and the type of traffic propagated through these links depends on the kind of links that are established.
Mapping the AS-level topology provides several benefits, allowing network operators to optimize routing paths and reduce latency. Identifying the problematic AS can help troubleshoot any network issues. Understanding the AS-level topology will also enable ISPs and large organizations to make informed decisions, such as choosing optimal partners for peering to improve their access speeds and reduce transit costs. AS-level topology also provides network operators with data to study the structure and evolution of the Internet, which can support long-term network planning and investment decisions.
Numerous attempts have been made to accurately map the Internet’s topology at the Autonomous System (AS) level. However, much publicly available information regarding ASes is incomplete or lacks crucial links. There are two methods for inferring AS-level topology: BGP-based or traceroute-based. Although extensive research has been conducted using BGP route advertisements, DNS probing, longitudinal studies of the Internet, and measuring traffic and statistics on an individual provider, these studies have mainly focused on capturing a snapshot of the ever-changing topology of the Internet or have used active probing methods in IP which fail to convert into AS-level information accurately.
Understanding BGP is crucial for network operators as it dictates how data flows across the internet, affecting everything from browsing speed to system security.
Our research enhances the active BGP probing technique proposed by Colitti et al. by deploying an advanced simulation environment that mirrors the complexities of the real Internet, encompassing both ASes and IXPs. Utilizing this simulation, we meticulously analyze the dynamics of BGP and scrutinize the repercussions of BGP poisoning on both Transit and Tier-1 ASes. Our study’s primary objectives are to gauge BGP poisoning’s efficacy in unveiling hidden AS-level connections, ascertain the most effective methodologies for implementing BGP poisoning, and devise strategies that mitigate its adverse effects on network infrastructure. This study maps hidden network pathways and discusses the implications of these findings for enhancing network security and stability. Our research equips network operators with the insights needed to optimize routing decisions and improve the robustness of their network management by delineating potential pathways for BGP poisoning and unveiling hidden network links. Ultimately, this work aims to furnish network administrators with the tools and knowledge to fortify their networks against routing anomalies and security threats, thereby ensuring a more stable and secure Internet infrastructure.
This project makes significant contributions to the field of network topology analysis and simulation:
- We have designed a novel algorithm for generating a network topology that mirrors the intricate structure of the real Internet, enabling more accurate and realistic simulations of network behaviors and interactions.
- We have developed and deployed an advanced simulation environment that facilitates the detailed study of BGP dynamics.
- We have formulated and tested strategies to reveal hidden network connections. These strategies are designed to minimize the adverse effects of BGP poisoning, enhancing network stability and security while improving the accuracy of topology mapping.
Our BGP Poisoning experiments discovered that the type of AS (Tier-1, Transit) and the proximity to the poisoning AS (Neighbors, Non-Neighbors) drastically affect the change in visibility and the new connections revealed by the poisoning. To maximize the effectiveness of BGP poisoning, we recommend conducting it from a well-connected Stub AS and targeting a non-neighboring Transit AS that contains indirect connections to it but is not entirely isolated. Lastly, to observe the most connections, BGP poisoning should be observed from a neighboring Transit AS to yield the most information gain. Through a Game Theory analysis of BGP poisoning, we also discovered that a Nash Equilibrium might exist depending on whether performance and stability are more valuable or knowledge is more beneficial to the poisoning ASes.
Background
Different types of ASes and BGP Connections are the key components in understanding internet topology and routing behaviors.
Types of ASes
In their research, Subramanian et al. identified five categories that comprise the hierarchical Internet: Dense Core, Transit Core, Outer Core, Small Region ISPs, and Customers. Although this provides a detailed outline of the ASes, these can be further simplified into three categories: Stub, Transit, and Tier-1.
- Stub ASes: These ASes lie on the edges of the Internet. They do not forward traffic to other networks and make up about 90% of all ASes. They are situated at the bottom of the hierarchy.
- Transit ASes: These ASes connect to several Stub ASes and Tier-1 ASes. They are primarily used to forward traffic to other networks, making up less than 10% of all ASes. They are situated in the middle of the hierarchy.
- Tier-1 ASes: These ASes connect in a mesh to form the Internet’s core. They make up less than 0.01% of the Internet and are at the top of the hierarchy.
Types of BGP Connections
BGP is a crucial system that determines how data packets are routed across the Internet through different ASes. While there are various BGP links between two ASes, the most prominently observed online are Provider-to-Customer (P2C) and Peer-to-Peer (P2P) links. P2C links are the most common type of links across BGP. Provider ASes generally want to advertise as many connections to their customer as possible, sharing their routes, other customer routes, provider routes, and peer routes. They want the customer to send their traffic through them as much as possible. Customer ASes, on the other hand, want to refrain from sending traffic through providers as much as possible; they only share their routes and the customer routes, choosing not to share information about their other providers or peers. A P2P link occurs when two ASes agree to exchange traffic without charging each other to avoid sending their traffic through a common provider link. While these peers share information amongst each other free of charge, they only share their routes and the customer routes, choosing to keep their other providers’ or peers’ routes private to avoid being used to carry traffic for their peers. Other links, such as Sibling-to-Sibling and Customer-to-Customer, also exist. However, these are much less common than P2C and P2P links. These link relationships collectively form the backbone of the internet topology and were first proposed in 2001 by Gao.
BGP Poisoning
BGP poisoning is a technique that bypasses these links by exploiting a very fundamental property within BGP to avoid loops within paths. BGP announcements are modified to include AS routes that do not exist. It might contain ASes that need to be avoided or announcements that make the poisoned AS appear shorter or more attractive. Since the BGP protocol relies on trust, routers that receive the false advertisements accept them and proceed accordingly, changing their routing decisions based on the poisoned announcements. This leads to traffic being diverted from its traditional flow and could cause links that would typically not carry specific traffic to carry that traffic. These poisoned announcements can later be withdrawn, allowing the routing tables across the Internet to converge back to their original state.
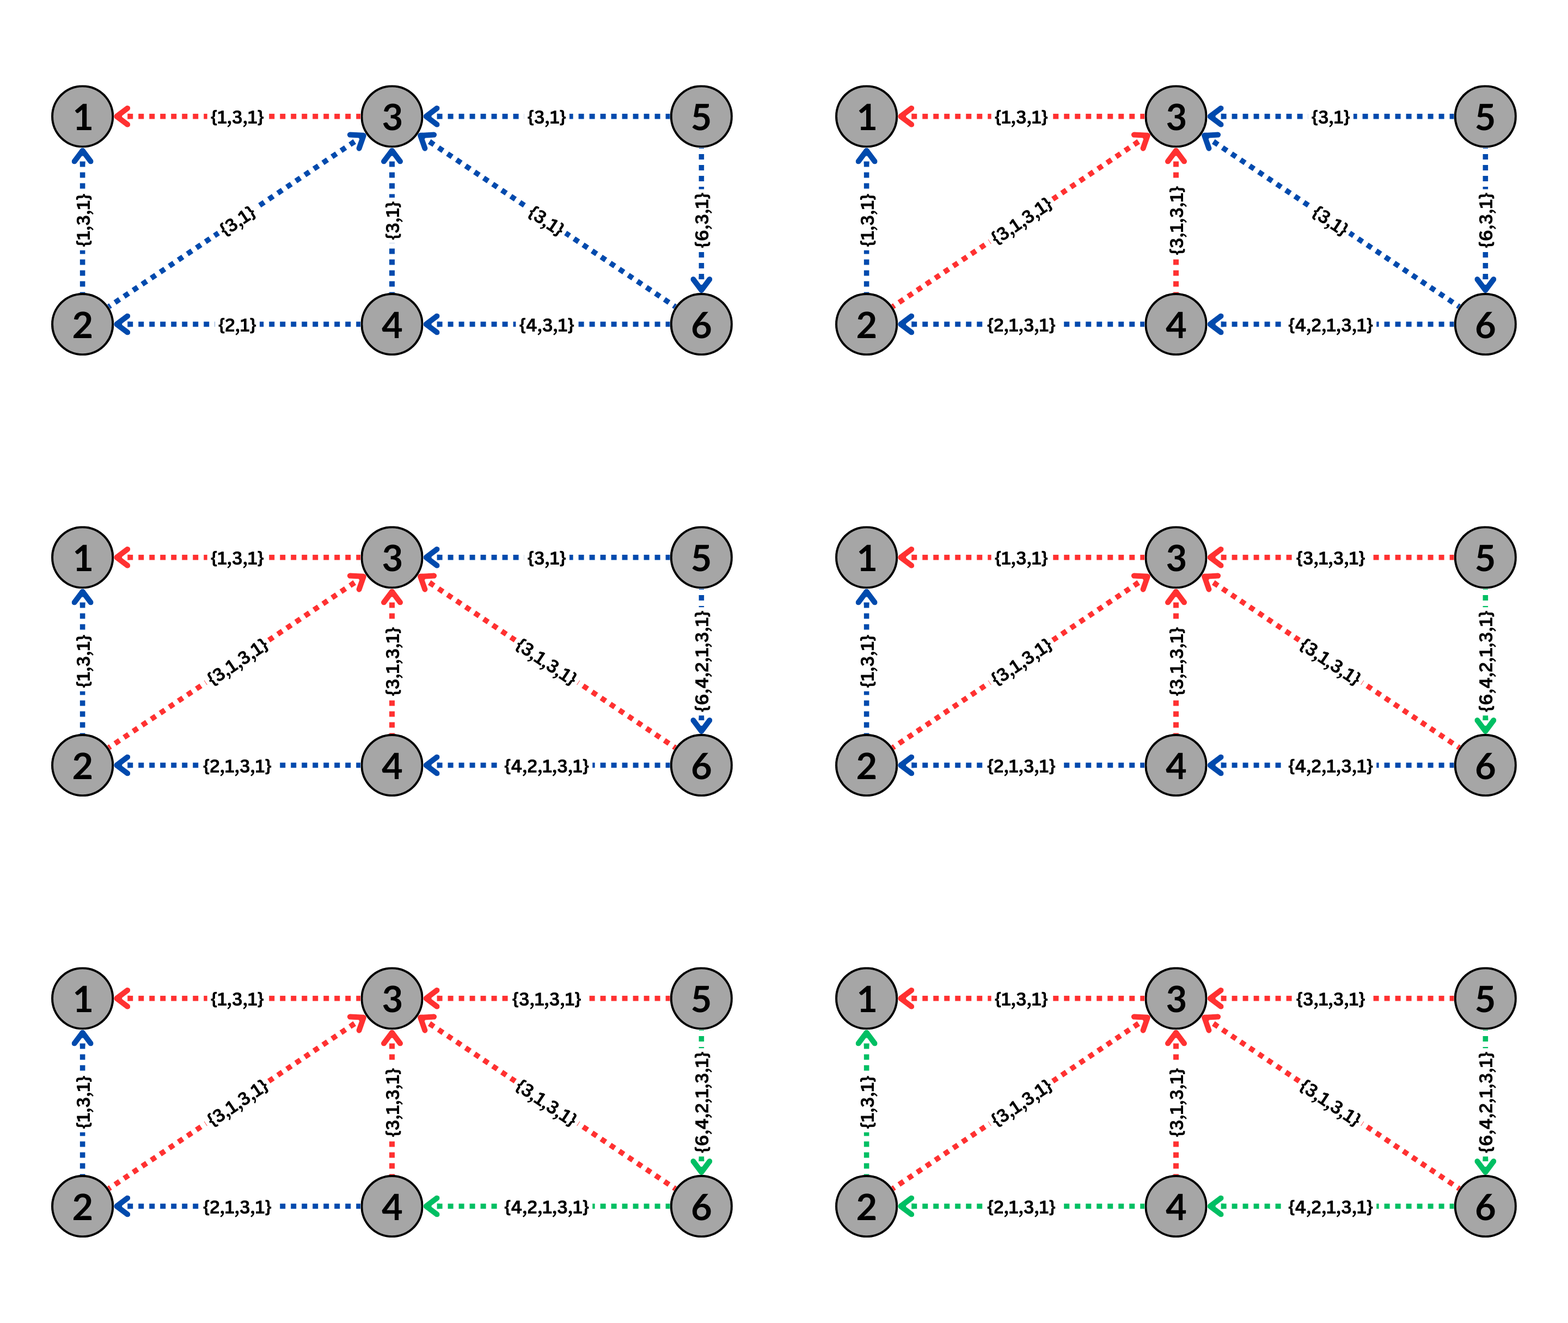 BGP Routing without BGP Poisoning
The Figure above shows six nodes representing individual ASes. The arrows depict each AS path to send traffic through BGP to AS1. The blue arrows indicate an available path, while the green arrows indicate the optimal path to send traffic from AS5 to AS1, which would be through AS3.
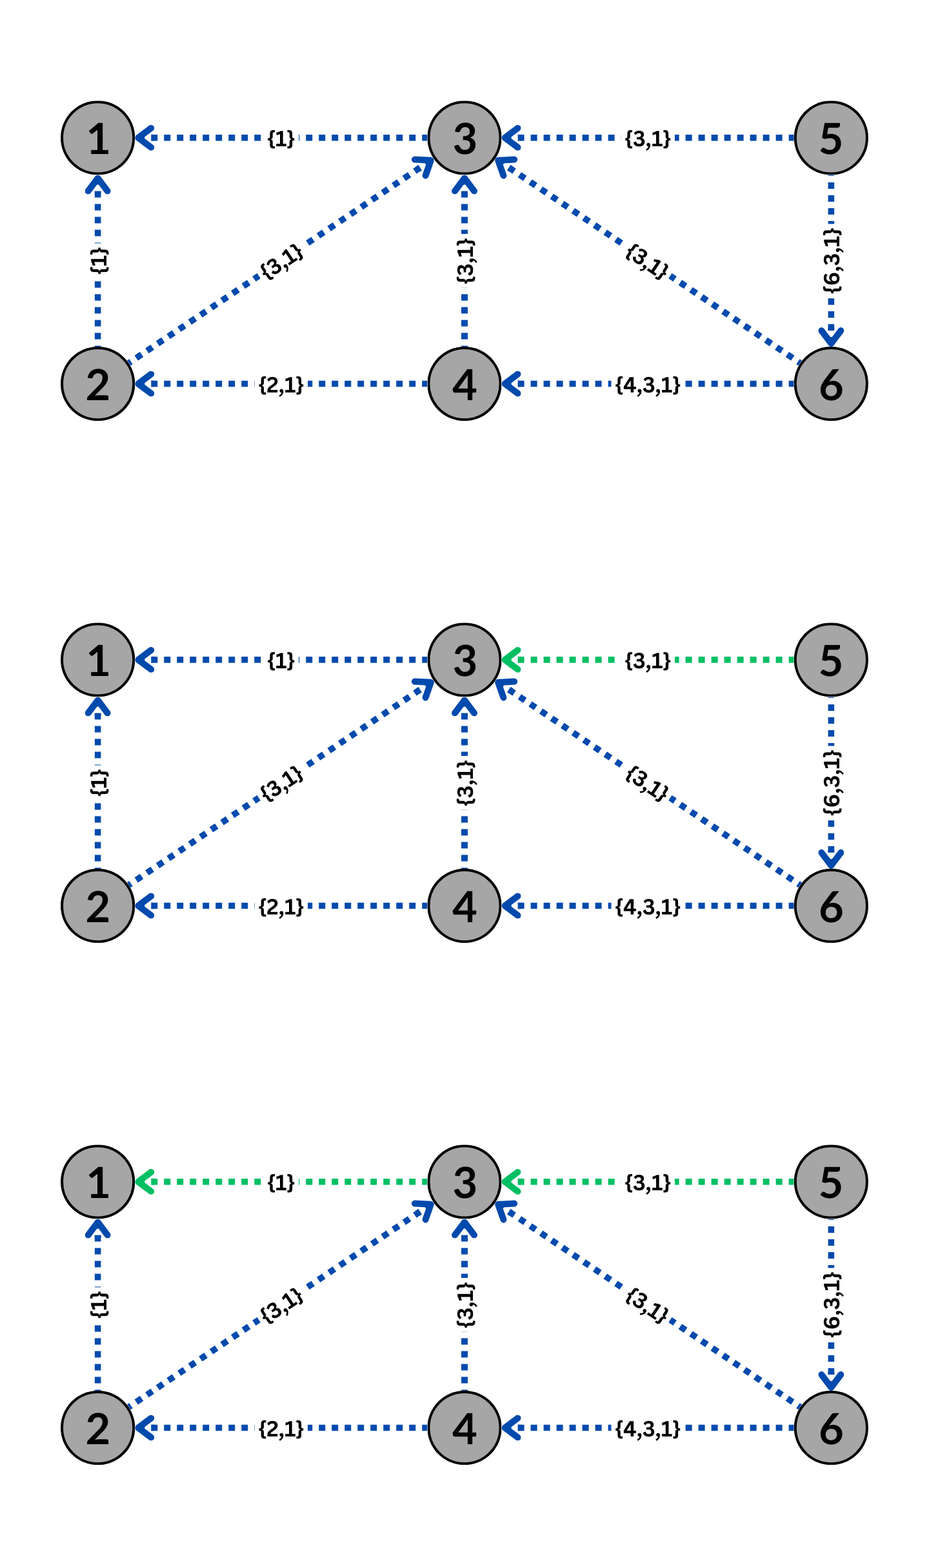 BGP Routing with BGP Poisoning to avoid AS3
The Figure above shows BGP poisoning performed by AS1 on AS3. As a result, the routes that go through AS3 will no longer be valid due to the BGP property to avoid loops, causing the ASes to route the traffic around AS3.
Effective BGP poisoning can only occur in a specific way with the poisoned AS or set of ASes included between the path advertised by the poisoning AS. For instance, in the Figure above, poisoning AS3 with the path {3,1} instead of the displayed {1,3,1} would result in the traffic being routed towards AS3 instead of the poisoning AS1, thus rendering the poisoning ineffective. Poisoning AS3 with the path {1,3} would cause any traffic from AS1 to show up as coming from AS3, which would lead other ASes to assume invalid connections between AS3 and other ASes, causing significant disruptions to the entire network. Therefore, the only way to conduct BGP poisoning effectively is to encapsulate the poisoned AS within the path of the AS itself.
Additionally, poisoning is only effective when performed on Transit and Tier-1 ASes. This is because Stub ASes lie on the edge of the Internet; poisoning them would not bypass any routes but instead exclude them entirely. Transit and Tier-1 ASes, on the other hand, are heavily interconnected. Therefore, there is a high likelihood of an alternate path if these ASes are poisoned.
In practice, BGP poisoning requires two ASes to coordinate. One AS is responsible for advertising the path changes, while the other is responsible for aggregating and identifying any path changes and hidden links discovered due to the poisoning.
Literature Review
Extensive research has been conducted to identify methods for discovering AS-level topology. While numerous studies exist in this field, almost all depend on BGP routing tables or active IP probing to deduce the topology.
BGP Routing
This is the most direct method of inferring AS-level topology. Information about the BGP routing tables and the paths taken can help infer connections between ASes.
Lixin Gao presented some of the earliest works on inferring AS-level topology. They utilized the University of Oregon’s RouteViews project to obtain real-time BGP information from Tier-1 and Tier-2 ISPs. By following BGP’s natural tendency to go uphill and downhill without valleys, they presented heuristic algorithms that could infer the P2C and customer-to-customer relationships. They further narrowed down their pool of connections to identify potential P2P connections.
Subramanian et al. expanded on Gao’s research using data from ten Telnet Looking Glass servers. Their research aimed to provide a comprehensive view of the Internet topology. They started with the premise that the Internet comprises a small number of larger ISPs connected to a much larger number of smaller ASes. Using their vantage points and this methodology, they were able to identify five categories of ASes that make up the Internet and study the interactions between them.
Olivera et al. wanted to evaluate the accuracy of these inferred topologies, as Subramanian and Gao proposed. They collected BGP routing data from various publicly available repositories such as RouteViews and RIPE NCC, as well as from looking glasses and routing registries. Additionally, they contacted operators of select ASes and examined their configurations and system logs from routers to verify the actual AS-level topology. They found a significant difference between the inferred public view and the actual AS-level connectivity. They recommended using historical BGP updates to improve the quality of AS-level topology, revealing backup connections that are not visible in single snapshots collected over time.
Gao and Subramanian’s initial work indicated that using BGP routing data to infer an AS-level topology is possible. However, Olivera’s research identified the gap between the observed AS-level topology and the actual topologies. Olivera’s solution to collecting historical BGP routing data significantly improves the topology. However, it requires considerable time and due process to be effective.
IP Probing
Another method of gathering AS-level topology is active IP probing. This method involves sending IP probes to map the router-level topology, which is then categorized into ASes to create an AS-level topology.
Huffaker et al. described some of the earliest methods for mapping AS-level topology using IP probes in their research. They employed a tool similar to traceroute called “skitter”, which utilized ICMP packets with increasing TTL values after each consecutive response. The researchers then cross-referenced this data with the public repository of RouteViews, which links ASes with routers to infer the overall AS-level topology.
Chen et al. focused their research on using traceroute to identify AS-level connections that were not visible through publicly available BGP routing data. They collected traceroute measurements from over 992,000 IPs across over 3700 ASes using a Peer-to-Peer client named Ono. They used direct IP-to-AS mappings using data provided by Team Cymru. As a result, they discovered about 12.86% additional P2C links and 40.99% additional P2P links.
Huffaker and Chen’s research reveals that active probing helps identify potential AS-level connections. While methods such as traceroute and other IP probing methods can be effective, they also have issues. For instance, IP-to-AS mappings may not be complete or entirely accurate, and traceroute packets are likely to be dropped or forwarded without changing their TTL or altered to affect the inferred path.
Hybrid Approaches
Research has also been done using alternate protocols or machine learning to infer AS-level topology.
Xu and Rexford proposed a new multi-path routing protocol or “MIRO,” which builds upon BGP, allowing ASes to select and advertise multiple paths. They aimed to enhance BGP’s ability to choose paths while remaining scalable and capable of controlling intermediate ASes in a path. The protocol was designed to maintain backward compatibility and be used in conjunction with BGP. Xu and Rexford used BGP tables from RouteViews and simulated MIRO, showing that it could significantly expose path diversity in the AS-level topology. With ASes able to express their route preferences and discover alternate paths not visible through traditional BGP, MIRO could reveal additional links and paths in the Internet’s topology.
Jin et al. attempted to use machine learning to infer AS-level topology. They proposed a “Toposcope” framework that uses ensemble learning and Bayesian networks to identify AS-level relationships from BGP route observations. They aimed to address the challenge of having fragmented data from various vantage points when inferring AS-level connections. They obtained data from public repositories such as RouteViews and RIPE NCC and used data from Isolario to supplement their dataset. Their goal was to identify relationships for upper-layer hidden AS links. They got a more comprehensive understanding of the AS-level topology by uncovering relationships that were not visible through traditional methods.
Peng et al. expanded on using machine learning by proposing a new framework called “AS-GCN” that used a Graph Convolutional Network. This framework predicted multiple relationships between ASes using features such as the common-neighbor ratio (ratio of shared neighbors between ASes to the total number of neighbors) and AS-type (the type of AS: Transit, content, enterprise, unknown). The authors used BGP paths from RouteViews and RIPE NCC to demonstrate the effectiveness of their framework. They were able to identify a variety of relationships beyond the commonly inferred P2C and P2P relationships.
While these methods offered alternative approaches to tackle some issues with passive BGP routing data collection, they also raised unique limitations. MIRO is unsuitable for widespread AS-level topology mapping, as it relies on other ASes to voluntarily provide a less efficient path to other ASes without any incentive. Similarly, Toposcope and AS-GCN use advanced algorithms capable of inferring relationships. However, they still rely on historical data from public repositories such as RouteViews and RIPE NCC to make accurate predictions.
BGP Poisoning
In 2005, researchers Colitti et al. conducted the first work on BGP Poisoning to discover concealed P2P and P2C links, as described in their thesis. They introduced a process called “AS-set stuffing,” which involved adding ASes they wished to avoid into the advertised paths. They created two algorithms - a level-by-level and a node-by-node - to identify concealed AS links. Given IPv6’s smaller size and functionality in 2005, they could test their level-by-level algorithm on the IPv6 and on a small testbed of experimental IPv4 prefixes. Their findings demonstrated the effectiveness of active BGP probing in revealing more detailed information about the Internet’s AS-level topology, including discovering new ASes and peerings that are not visible through passive observation methods.
Their research was further expanded in 2006, investigating how BGP announcements propagate across the Internet and how ISPs’ routing policies affect the visibility and reachability of prefixes. They wanted to understand the impact of BGP poisoning on network performance and security. They used BGP announcements and withdrawals observed through RIPE NCC and custom software to generate BGP updates, focusing on IPv6 and a smaller subset of IPv4 prefixes. Their findings revealed that this technique enabled the discovery of more ASes and peerings than traditional methods, highlighting the effectiveness of active BGP probing.
A study by Bush et al. investigated BGP poisoning to evaluate Internet reachability and identify biases in control-plane (BGP) and data-plane (active probing) measurements. The researchers used BGP poisoning to test the spread of a /25 prefix to uncover hidden upstream providers. They proposed a new methodology called dual probing, which combined BGP poisoning with outbound pings and traceroutes to assess reachability more accurately. The study revealed that relying only on control-plane data is insufficient, and data-plane measurements, while more reflective of actual reachability, have limitations similar to traditional IP probing.
This research was expanded upon by Anwar et al., who investigated the differences between existing interdomain routing models and the actual routing behavior. They used the public repository of RIPE Atlas to passively measure routing decisions towards popular content networks, using a method called “PEERING.” This method involved manipulating BGP announcements to expose less preferred paths. By comparing the two observations, the researchers found that 64.7\% of routing decisions followed the traditional model. However, a significant amount did not follow this model. Instead, they were influenced by prefix announcements, sibling ASes, and geographic considerations. The researchers emphasized the need for more nuanced models to capture the diversity of routing policies in practice.
In a study conducted by Smith et al., the researchers aimed to investigate the impact of BGP poisoning on security. They carried out a comprehensive experiment by performing active BGP poisoning measurements using control and data-plane infrastructures, such as BGP routers, RIPE Atlas probes for traceroutes, and BGP update collectors from CAIDA. As a result, they executed 1460 BGP poisoning instances across various ASes to assess the practicality of BGP poisoning and its impact on routing and security implications. They discovered that BGP poisoning, while disruptive when used to share data, could be effectively used to find previously unreachable AS-links, with its limitation being the changing prefix and loss of connectivity.
The research conducted by Colitti aimed to map the Internet’s topology using AS-set stuffing. They used a level-by-level search algorithm over a node-by-node algorithm, which was considered faster due to the disruptive nature of BGP poisoning, the long intervals required between probes, challenges such as BGP dampening, and the requirement of several collectors. However, recent advancements in BGP poisoning proposed by Katz-Bassett et al. have minimized the disruption caused by BGP poisoning. Other research works by Bush, Anwar, and Smith showcase the effectiveness of BGP poisoning and the need to map hidden AS links across the Internet. Although the study’s authors do not provide specific algorithms for mapping between Autonomous Systems (ASes), they rely on and build upon existing public repositories. However, this approach may not be feasible or relevant for smaller ASes attempting to map connections with other stub or transit ASes. Hence, there is a need to understand better the dynamics of BGP poisoning and its implementation to uncover the most hidden connections while minimizing the disruption caused by BGP poisoning. This should be done in a practical way that ASes can directly deploy.
Methodology
Topology Generation
Our simulation methods are designed to mirror real-world internet structures and behaviors, providing insights that are both accurate and applicable to current network challenges.
Topology Generation Algorithm
Extensive research has been conducted on tools that generate AS-level topology. However, each tool has its limitations, such as being unable to simulate different types of ASes or links, using randomly generated plots, or generating only a 3000+ node topology.
To address these issues, we developed a new algorithm for AS-level topology generation in Python. The customizable algorithm can generate topologies based on user-specified parameters and a random seed. It creates P2C and P2P links between nodes and can generate different AS types of ASes (Stub, Transit, Tier-1).
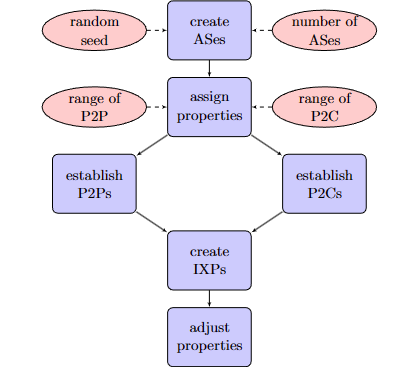
The Figure above shows the topology generation process. The algorithm can create a complex interconnected AS-level topology that mirrors the Internet’s hierarchical and mesh-like structure. This topology consists of P2C and P2P connections and is further interconnected with IXPs.
Our topology generation algorithm works as follows:
- Create ASes: We first create the specified number of ASes of different types (Tier-1, Transit, and Stub) based on predefined counts. This can be randomized or manually specified based on requirements. Each AS is given a unique ID and type.
- Assign Properties: Next, properties are assigned to the algorithm. This includes the range of P2P and P2C connections for a Stub AS, P2P and P2C connections for a Transit AS, and P2C connections for a Tier-1 AS.
- Establish P2C Connections: P2C connections are then established based on a random value within the range of P2C connections provided for Stub, Transit, and Tier-1 ASes. Stub ASes are connected to Transit with a 10% chance of linking to Tier-1 ASes as their providers. Transit ASes ensure they have at least one Tier-1 provider, and additional P2C connections are established as needed. This creates a hierarchical structure with Stub ASes at the bottom, Transit ASes in the middle, and Tier-1 ASes at the top.
- Establish P2P Connections: P2P Connections are established based on a random value within the specified range. Tier-1 ASes connect to form the core network. Stub ASes and Transit ASes establish P2P connections primarily amongst themselves but with a ten percent chance of a peering connection between Stub and Transit. This ensures network connectivity and redundancy.
- Create IXPs and Connect ASes: IXPs are then created and connected to various ASes. This includes connections between Tier-1 ASes and their customers and random connections between ASes of different types to simulate a complex real-world AS-level topology. There is a 10\% chance of a Tier-1 or Transit AS connecting with another Tier-1 or Transit AS through the same IXP and a 5\% chance of a Tier-1 connecting with other ASes or Transit connecting with a Stub AS through the same IXP.
- Adjust Connection Count: After establishing the connections for each AS, the actual number of connections is revisited. If an AS has fewer connections than initially assigned due to availability limitations within the topology, its connection count is adjusted to reflect the number of established connections.
| AS Type | P2P Range | P2C Range |
|---|---|---|
| Stub | 0-1 Connections | 1-2 Connections |
| Transit | 2-3 Connections | 5-10 Connections |
| Tier-1 | N/A | 6-10 Connections |
On the real Internet, these depend heavily on the type of AS and vary drastically; therefore, we decide to randomize it based on an appropriate range of values.
Topology Parameters
| Parameters | Real Internet | Simulation |
|---|---|---|
| Total ASes | Over 110,000 | 50 |
| Stub ASes | 92% | 37/50 (74%) |
| Transit ASes | 7.95% (large + small ISP) | 9/50 (18%) |
| Tier-1 ASes | 0.05% | 4/50 (8%) |
| Total P2C Links | 90.26% - 94.40% | 72/97 (74.22%) |
| Total P2P Links | 5.1% - 9.28% | 25/97 (25.77%) |
| Tier-1 P2C Links | 39.41% | 19/97 (19.58%) |
| Tier-1 P2P Links | 1.36% | 6/97 (6.18%) |
| Transit P2C Links | 49.61% | 53/97 (54.63%) |
| Transit P2P Links | 9.62% | 12/97 (12.37%) |
The Table above compares the parameters we used for our simulation with the values that prior research identified regarding the real Internet. A breakdown of the considered values is as follows:
- Total ASes: We consider 50 ASes, a manageable number allowing us to create a more controlled environment to observe BGP poisoning effects without the complexity and scale of the real Internet.
- Stub ASes: The simulation has a lower percentage of Stub ASes. However, it still represents the majority, mirroring the dominance of stub ASes in the real world, allowing a more focused study on their behavior and impact during BGP poisoning.
- Transit and Tier-1 ASes: The simulation increases the percentage of Transit and Tier-1 ASes compared to the real Internet. Despite the small network size, this adjustment ensures that the simulation has sufficient critical ASes to study their role and reactions during BGP poisoning.
- Total P2C and P2P Links: The simulation contains a slightly higher percentage of P2P links but primarily follows the real Internet’s distribution. This ensures realistic interactions between different types of ASes, which is crucial for studying BGP dynamics.
- Tier-1 and Transit Links: The simulation has a lower percentage of Tier-1 P2C and P2P links than the real Internet but maintains a proportional representation. This is done to simplify the complexity of top-tier AS interactions while capturing the essence of their connectivity and influence on BGP routing.
Mini-Internet Simulation
We explored tools that simulate BGP connections for studying and understanding AS-level topology. However, we chose to use the mini-internet project developed by Holterbach et al. due to its high customizability and open-source nature. This project utilizes docker containers for ASes and employs Open vSwitches and FRRouting to deploy switches and routers within the topology. It also has a looking-glass service that provides access to updated routing tables across the topology, which can be used to automate data collection.
To meet our specific requirements, we modified the Mini-internet configuration by removing some unnecessary modules. We also adjusted the AS configuration to create a Layer 3 topology with only two routers (RTRA and RTRB). RTRA handled all the P2C and P2P connections between nodes, while RTRB was responsible for all IXP connections. We eliminated the implementation of a Layer 2 topology.
We simulated a Ubuntu 20.04 instance with 16GB RAM, 4 CPU cores, and 40GB storage.
| AS Type | Count | Avg. P2P | Avg. P2C | Avg. IXP |
|---|---|---|---|---|
| Tier-1 AS | 4 | 3.00 | 4.75 | 2.25 |
| Transit AS | 9 | 2.44 | 7.44 | 3.67 |
| Stub AS | 37 | 0.43 | 1.57 | 1.81 |
| IXP | 18 | N/A | N/A | N/A |
The Table above shows the average number of P2P, P2C, and IXP connections for different types of ASes used within the simulation.
BGP Poisoning Implementation
To map the network topology, we iteratively poison Tier-1 and Transit ASes using the Stub ASes and observe changes in their preferred paths.
We use the collected data and compare it with the paths before the poisoning occurred to establish the changes in visibility within the topology and the number and type of new links that the poisoning revealed.
BGP Poisoning Sample Size
We picked 14 out of 37 ASes for our data collection to perform poisoning. These ASes covered a significant portion of the possible combination of peers, providers, and IXPs among the Stub ASes in the topology.
| AS | # of Peers | # of Providers | # of IXPs |
|---|---|---|---|
| 14 | 0 | 2 | 2 |
| 15 | 1 | 2 | 2 |
| 16 | 0 | 1 | 2 |
| 17 | 1 | 1 | 2 |
| 18 | 0 | 2 | 3 |
| 19 | 0 | 2 | 2 |
| 20 | 1 | 2 | 2 |
| 21 | 0 | 2 | 2 |
| 24 | 1 | 1 | 1 |
| 27 | 0 | 1 | 1 |
| 30 | 1 | 1 | 1 |
| 33 | 0 | 1 | 4 |
| 37 | 1 | 1 | 2 |
| 41 | 0 | 2 | 2 |
The Table above shows the ASes chosen to conduct BGP poisoning for our experiments. To ensure our results represented the entire topology, we decided to consider ASes based on stratified sampling, ensuring we chose ASes containing different connection levels. The ASes within this sample have either one or two providers and either zero or one peer, mirroring the possible range of provider and peer connections in stub ASes. The number of IXPs also ranges from one to four, allowing us to assess the role of IXPs in network connectivity. Lastly, we included the extreme cases, including the lowest and the most IXPs. Our coverage would ensure that the findings from our analysis can be generalized to the entire set of Stub ASes.
Data Collection and Measurement
To observe the effects of poisoning across the network, we started by establishing a baseline using the BGP routing tables of all the ASes in the network. Then, we poisoned the network iteratively by selecting certain ASes and poisoning all the Transit and Tier-1 ASes. After each poisoning, we collected the altered BGP routing tables of all the ASes. We compared them to the established baseline to get the change in visibility and the number of new connections discovered per poisoning.
We measure these changes through the following two metrics:
- New Connections Discovered: This is the number of new connections the AS discovered after poisoning occurs. This does not account for any previously known connections and identifies the number of connections it became aware of after the poisoning occurred.
- Change in Visibility: This is the change in the percentage of visibility of the entire topology between what the AS had initially observed in the baseline and what the AS observes after poisoning has occurred. This variable considers any connections that might no longer be possible due to the poisoning and any new connections that might be observed through poisoning.
Results
The results of BGP poisoning should be interpreted carefully, as they can significantly impact network performance and security.
AS topology
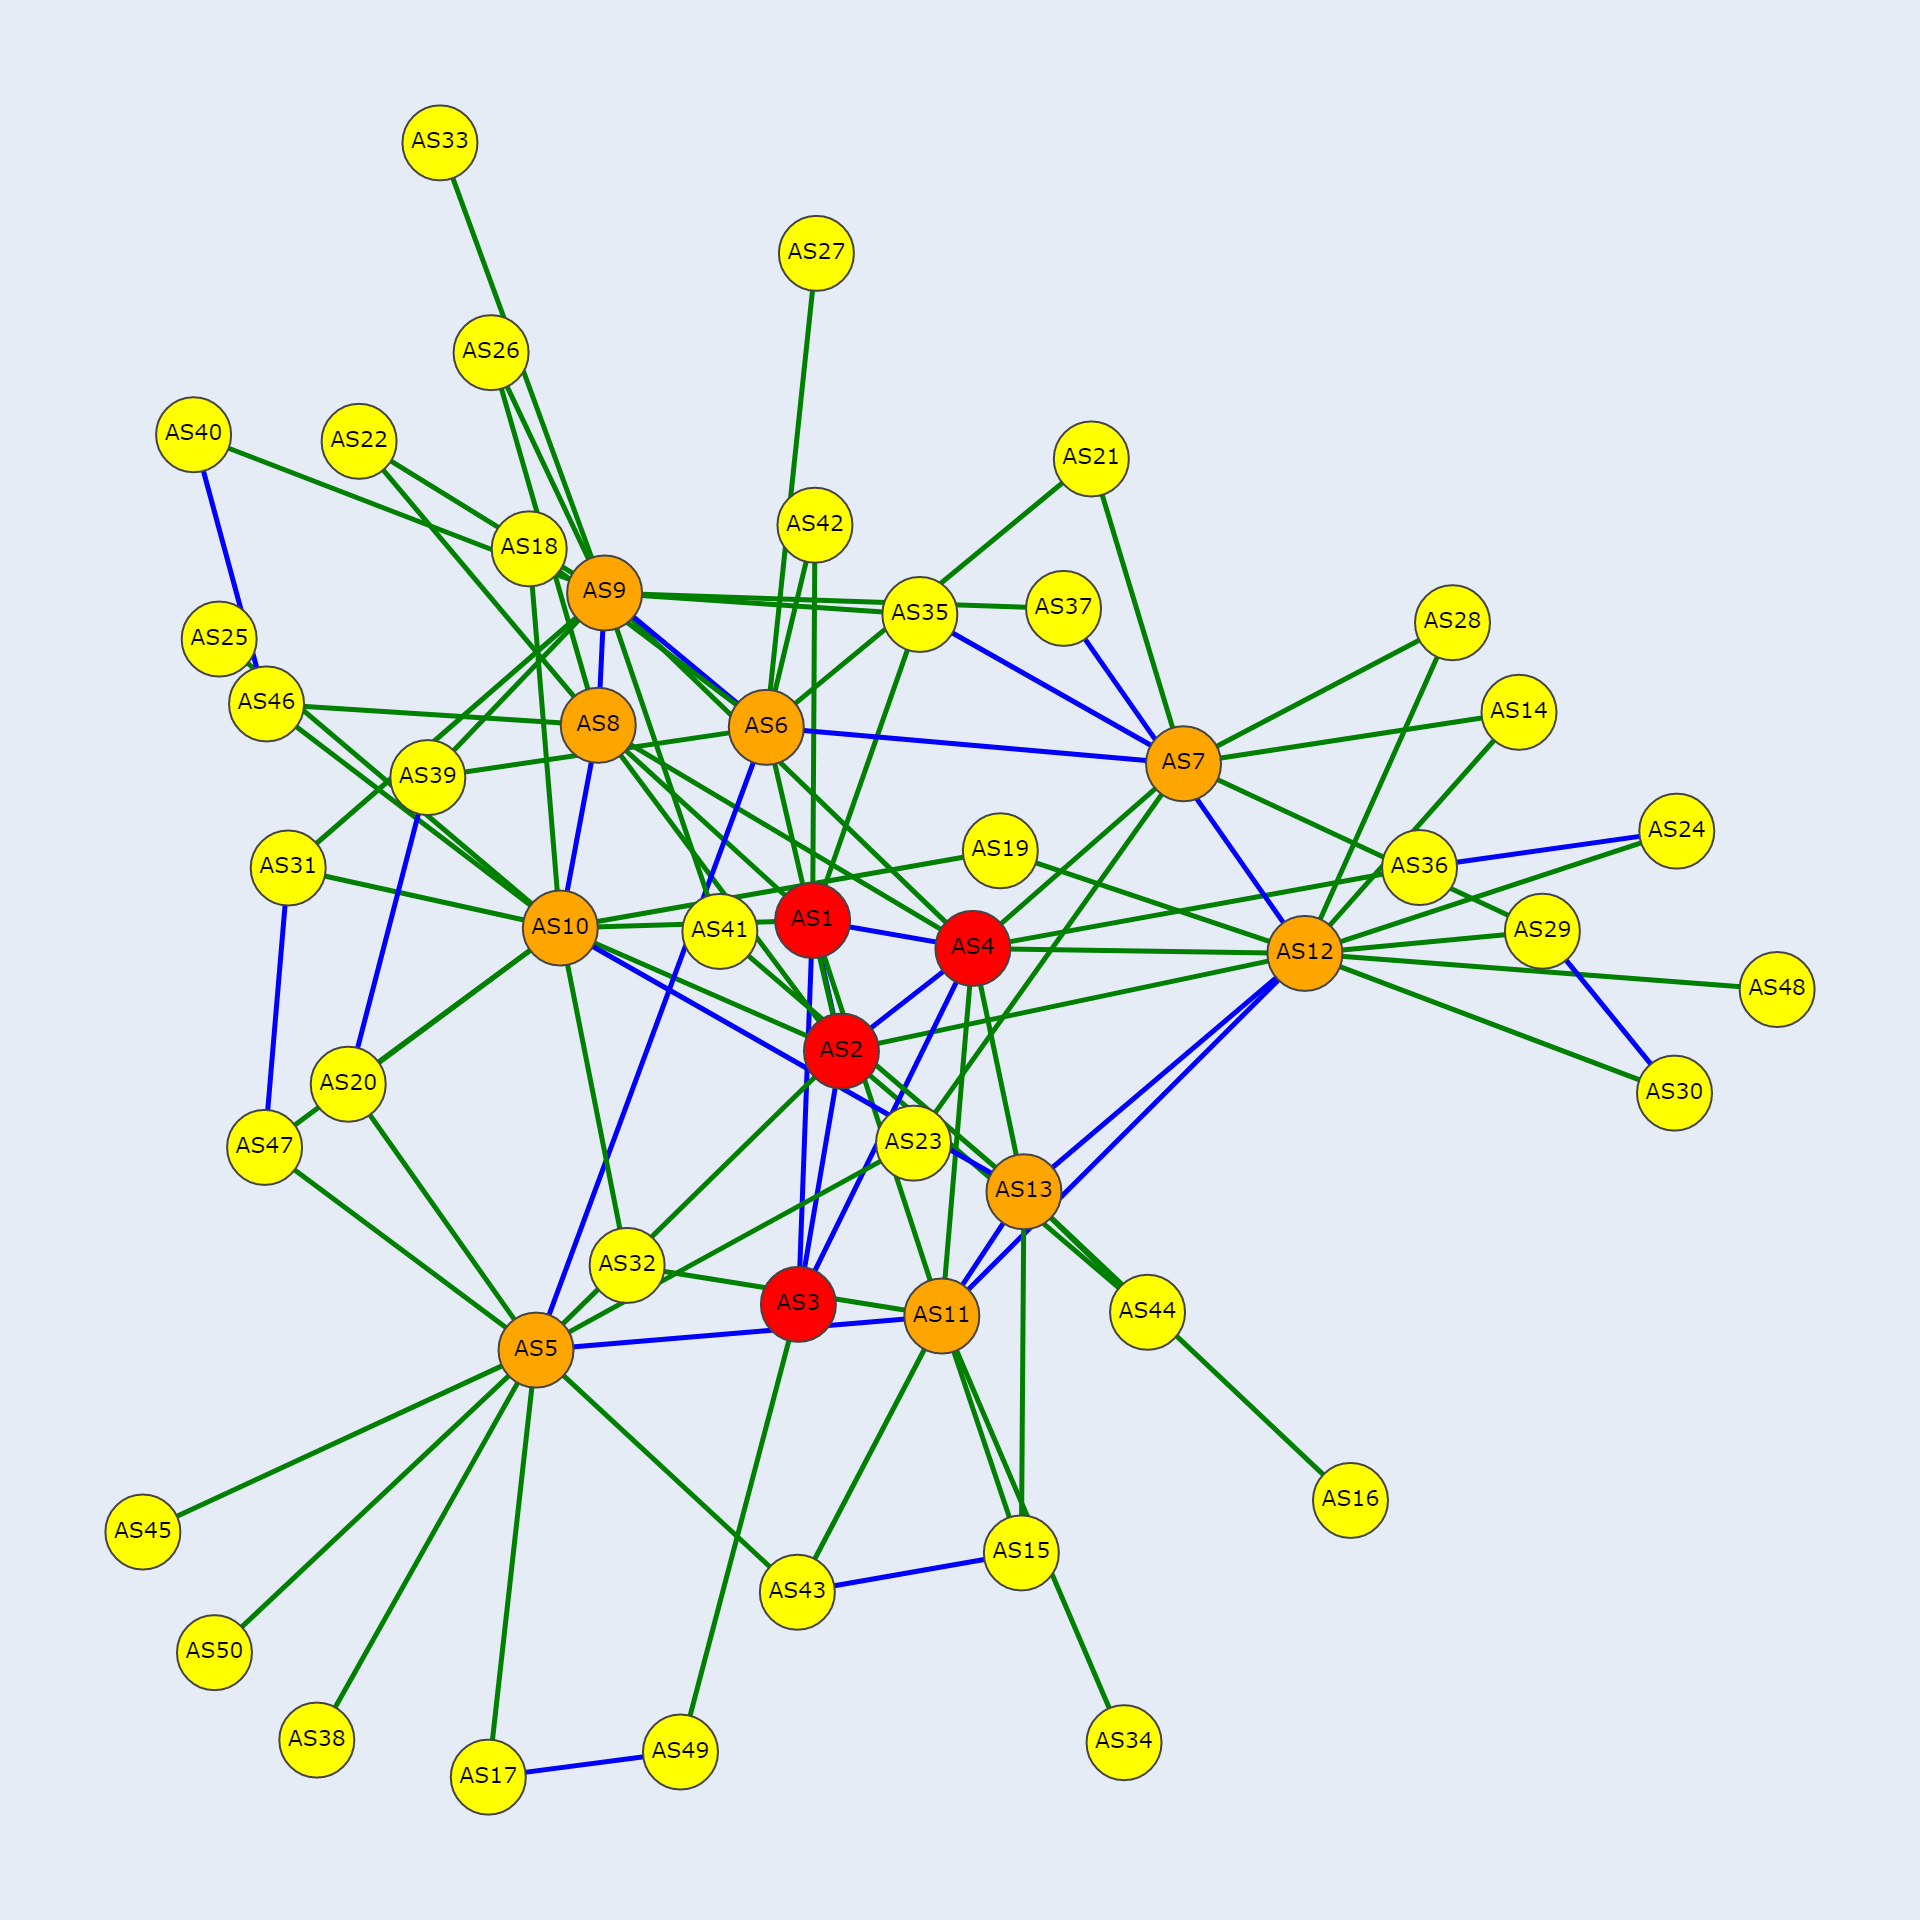
The simulation used in our experiments comprises 50 ASes that are interconnected to simulate the real Internet.
The Figure above shows the connections between these ASes. The red nodes represent the Tier-1 ASes, the orange nodes represent Transit ASes, and the yellow nodes represent Stub ASes. The green edges indicate P2C connections, while the blue edges indicate P2P connections between two nodes. This does not include the IXPs.
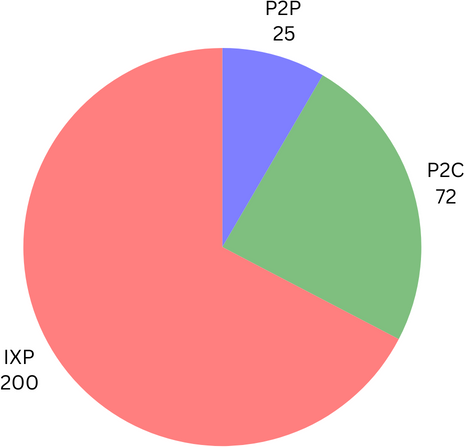
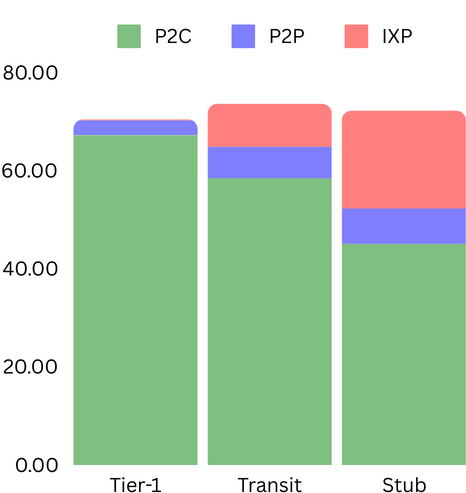
There are 297 total connections, of which 200 are AS to IXP connections, 72 are P2C connections, and 25 are P2P connections. In the baseline, on average, Tier-1 ASes can mostly see P2C (67.25), with very few P2P (3.0) and almost no IXP (0.25) connections. On average, Transit ASes can see the most number of links, the majority of which are P2C (58.44), with some IXP (8.77) and fewer P2P (6.44). Average Stub ASes can see several P2C (45.08), with the most IXP (19.97) and some P2P (7.21) connections. On average, an ASes visibility is around 72.14 connections (24%) of the ground truth.
Effect of Poisoning on the topology
| AS Type | Visibility Change | New Connections | P2P | P2C | IXP |
|---|---|---|---|---|---|
| Tier-1 AS | 2.178 | 8.902 | 1.548 | 2.401 | 4.953 |
| Transit AS | 1.776 | 10.459 | 1.206 | 4.526 | 4.726 |
| Stub AS | 0.440 | 8.449 | 1.021 | 5.575 | 1.852 |
| Total | 0.820 | 8.847 | 1.097 | 5.132 | 2.617 |
The Table above lists the effects of BGP poisoning on the topology across different ASes. The average change in visibility from poisoning is 0.820, and the average number of new connections discovered is 8.847, of which the majority are P2C connections (5.132).
Effects of Poisoning Tier-1 and Transit ASes
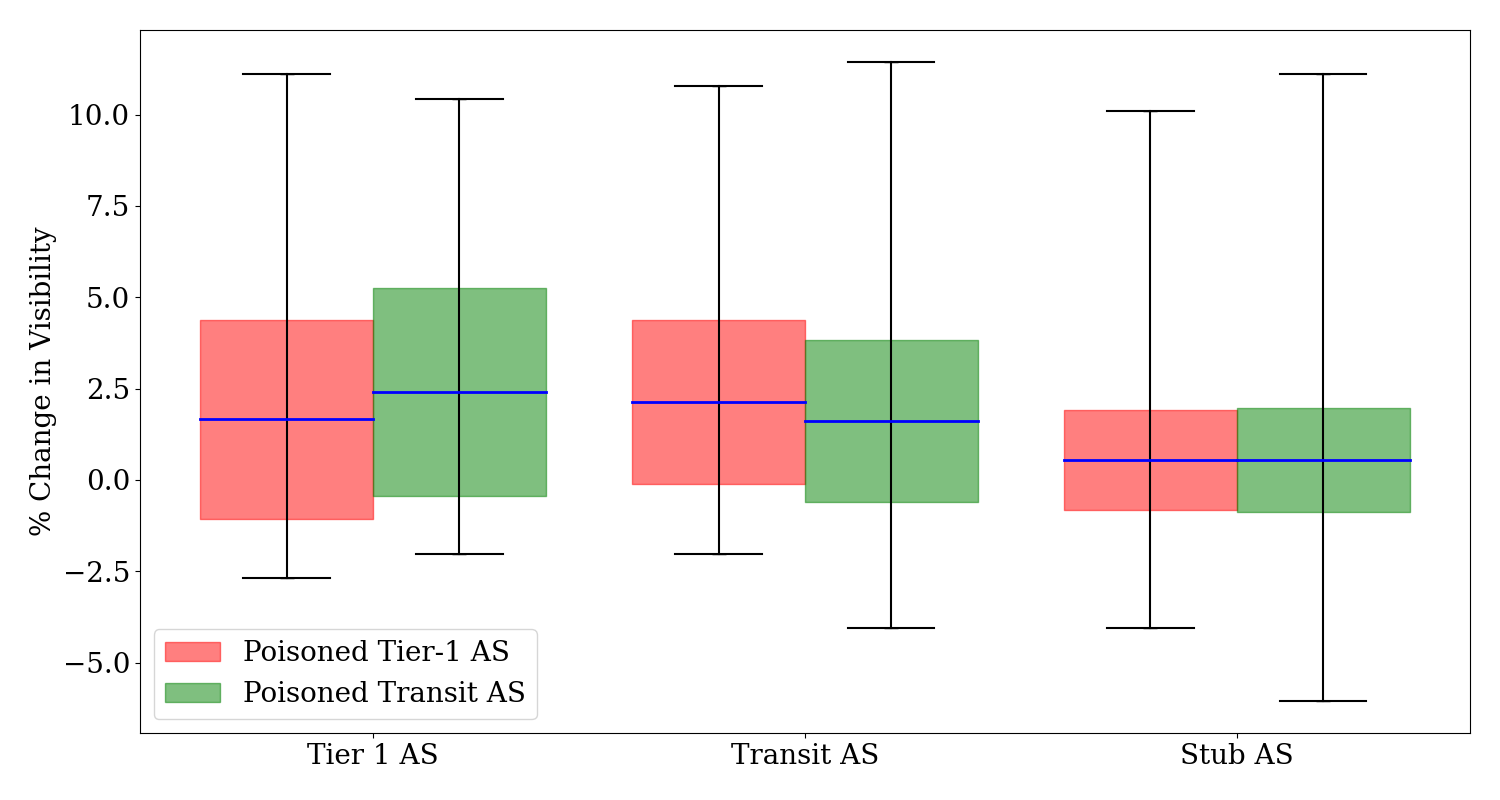 Avg. % change in visibility for Tier-1 and Transit ASes upon BGP Poisoning
The Figure above illustrates the impact of poisoning Tier-1 and Transit ASes on the visibility of different ASes. When poisoning a Tier-1 AS, the visibility change exhibits a mean of 1.65% for Tier-1 ASes, 2.14% for Transit ASes, and 0.54% for Stub ASes, with the highest change reaching 11.11%. Poisoning a Transit AS results in a mean visibility change of 2.41% for Tier-1 ASes, 1.62% for Transit ASes, and 0.56% for Stub ASes, with maximum changes peaking at 11.44%. Poisoning a Transit AS gives us more visibility within Tier-1 ASes, with a smaller range, while poisoning a Tier-1 AS gives us more visibility within Transit ASes, with a smaller range. Overall, the highest visibility and range are achieved by poisoning a Transit AS with the most significant impact on Tier-1 ASes.
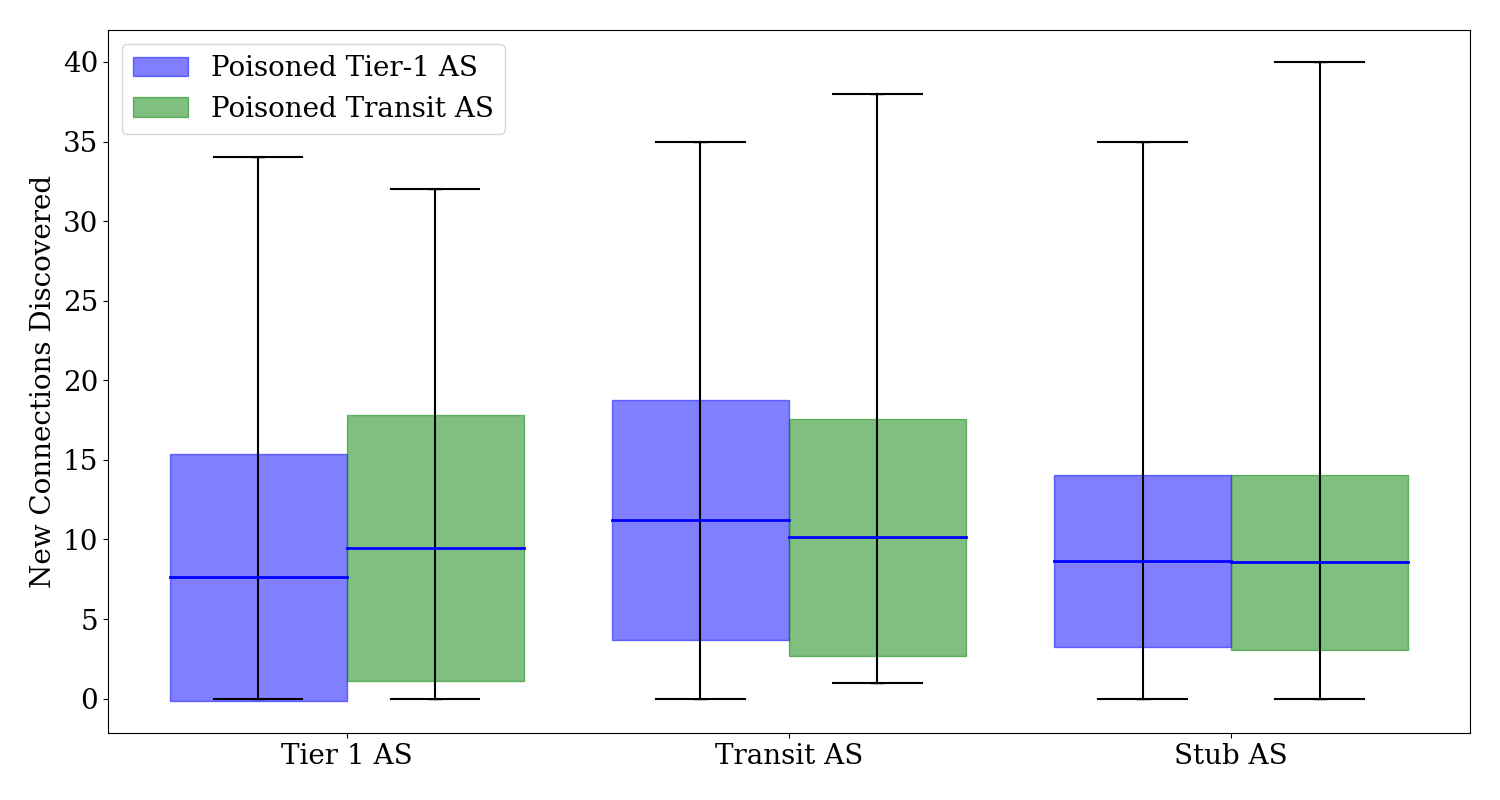 # of new connections discovered after poisoning Tier-1 and Transit ASes
The Figure above depicts the number of new connections identified after poisoning Tier-1 and Transit ASes. Post poisoning a Tier-1 AS, the average new connections found were 7.61 for Tier-1 ASes, 11.21 for Transit ASes, and 8.65 for Stub ASes, with a maximum discovery of 35 new connections. The mean new connections recorded for poisoning a Transit AS were 9.48 for Tier-1 ASes, 10.12 for Transit ASes, and 8.55 for Stub ASes, reaching up to 40 new connections at the peak. Poisoning a Transit AS reveals more new connections within Tier-1 ASes, with a smaller range, while poisoning a Tier-1 AS reveals more connections within Transit ASes, with a smaller range. Overall, the most connections are observed when poisoning a Tier-1 AS, with the most significant impact on Transit ASes, although poisoning Transit ASes achieves the highest range.
| Poisoned AS Type | AS Type | Avg. P2P | Avg. P2C | Avg. IXP |
|---|---|---|---|---|
| Tier-1 | Tier-1 | 1.214 | 2.464 | 3.933 |
| Transit | 1.343 | 4.694 | 5.176 | |
| Stub | 1.088 | 5.557 | 2.000 | |
| Transit | Tier-1 | 1.696 | 2.373 | 5.406 |
| Transit | 1.145 | 4.452 | 4.526 | |
| Stub | 1.023 | 5.667 | 1.860 |
The Table above presents a detailed breakdown of the types of new connections (P2P, P2C, and IXP) observed in different AS types when Tier-1 or Transit ASes are poisoned. Poisoning Tier-1 ASes leads to higher average IXP connections in Transit ASes (5.176), while Stub ASes predominantly experience an increase in P2C connections (5.557). In contrast, poisoning Transit ASes significantly enhances IXP connections in Tier-1 ASes (5.406) and P2C connections in Stub ASes (5.667). Poisoning a Transit AS results in the most connections being revealed, with most P2P being observed by Tier-1 ASes, most P2C being observed by Stub ASes, and most AS-IXP connections being observed by Tier-1 ASes.
Effects of Poisoning a Neighboring AS
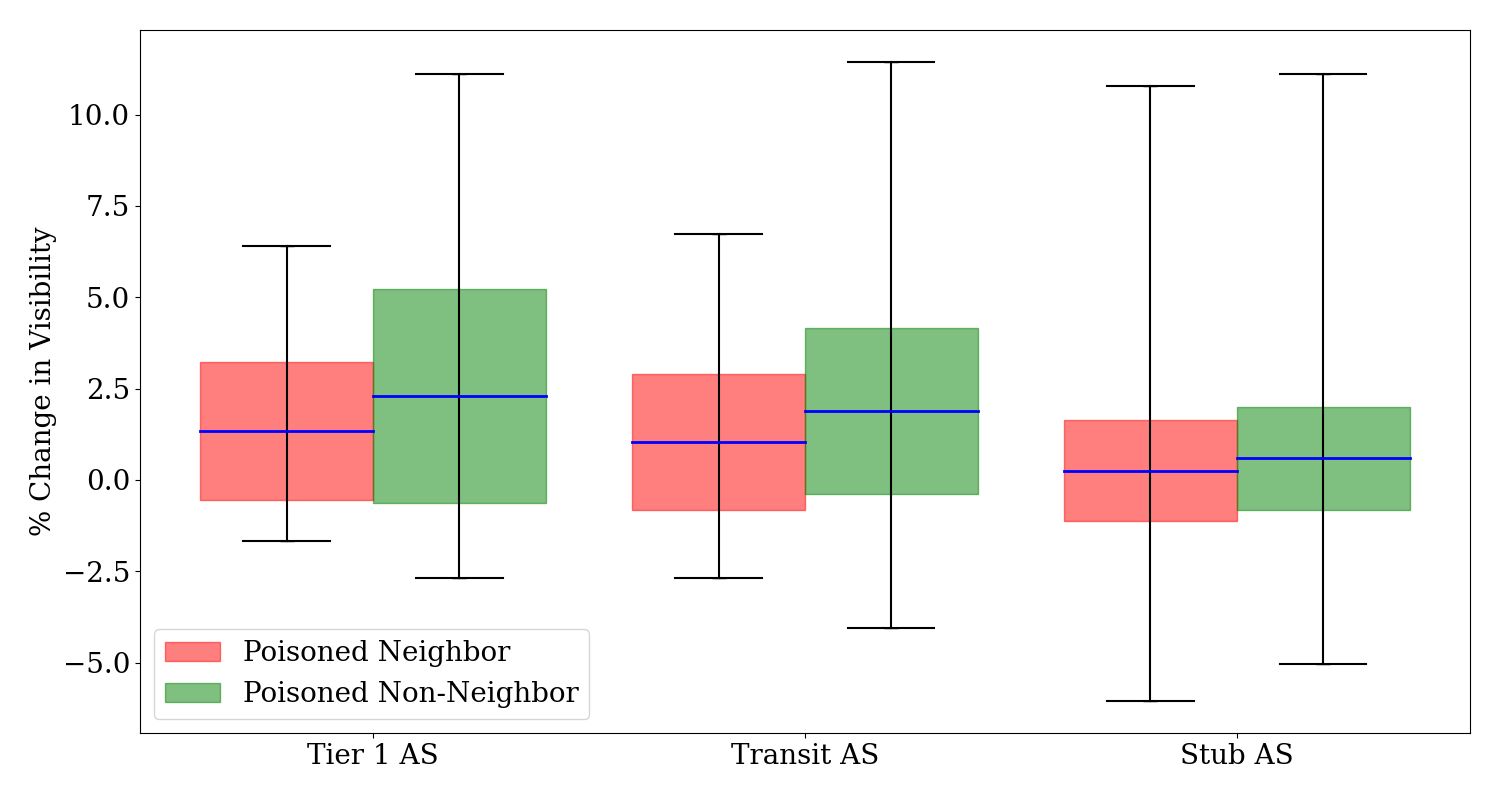 Avg. % change in visibility for ASes upon poisoning neighboring and non-neighboring ASes
The Figure above shows the average percentage change in visibility for Tier 1, Transit, and Stub ASes upon poisoning of neighboring ASes. The data reveals a mean visibility change of 1.34\% for Tier 1 ASes, 1.03\% for Transit ASes, and 0.25\% for Stub ASes upon poisoning a neighbor, with the maximum increase peaking at 10.77\% for Stub ASes, in contrast, poisoning non-neighboring ASes results in higher visibility changes, with a mean visibility change of 2.30\% for Tier 1 ASes, 1.88\% for Transit ASes, and 0.59\% for Stub ASes. Poisoning a non-neighboring AS consistently results in a more significant change in visibility across all types of ASes, with the most significant impact on Tier-1 ASes.
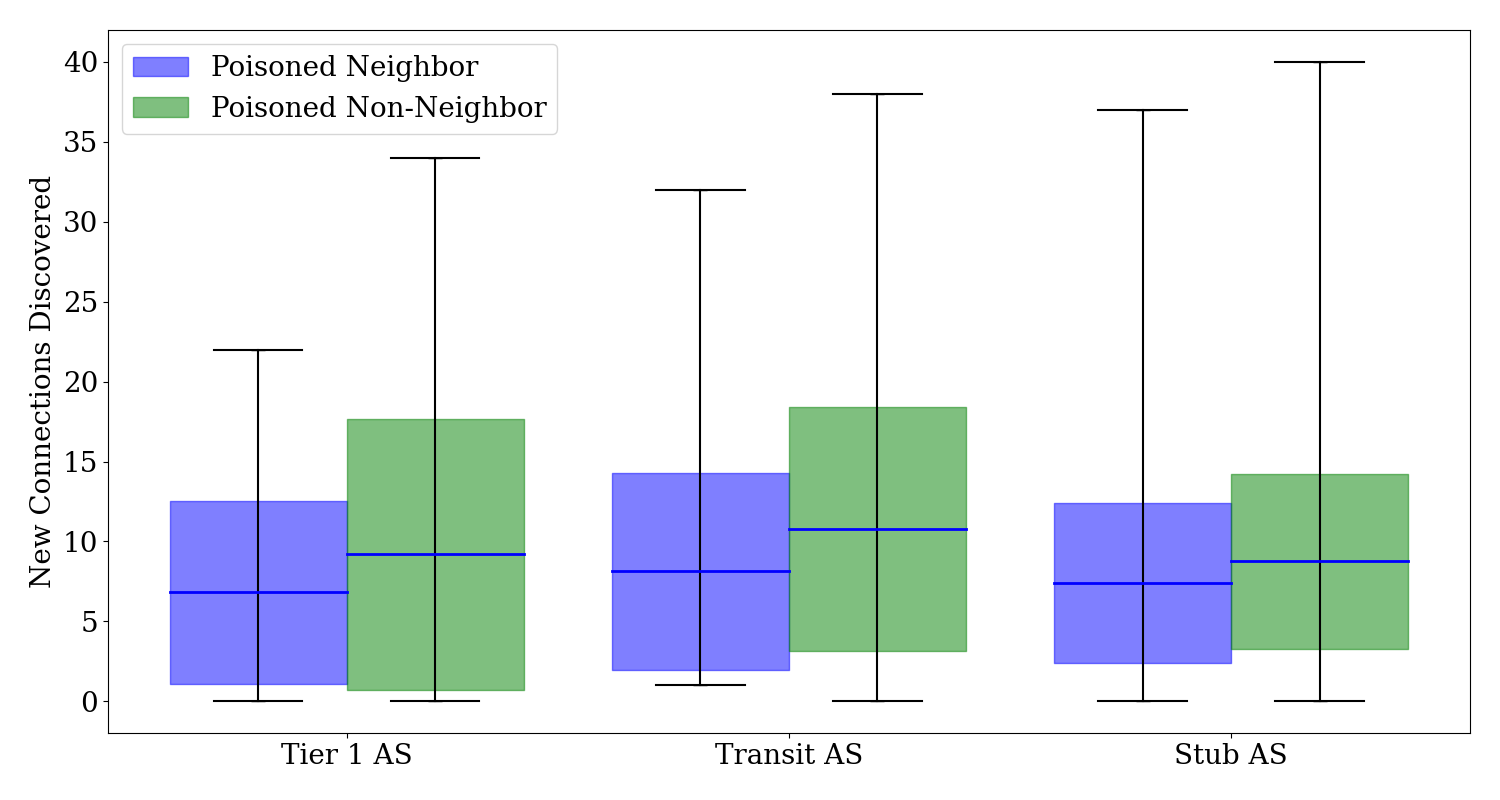 New connections discovered in ASes after poisoning neighboring and non-neighboring ASes
The Figure above showcases the number of new connections discovered in various AS types when a neighboring AS is poisoned. The analysis indicates an average of 6.84 new connections for Tier 1 ASes, 8.13 for Transit ASes, and 7.41 for Stub ASes, with Stub ASes witnessing up to 37 new connections. Comparatively, poisoning non-neighboring ASes leads to a higher number of new connections, with 9.20 for Tier 1 ASes, 10.79 for Transit ASes, and 8.75 for Stub ASes, with Stub ASes witnessing up to 40 new connections. Poisoning a non-neighboring AS consistently results in more connections being discovered across all ASes, with the most significant impact on Transit ASes.
| Poisoned AS Type | AS Type | Avg. P2P | Avg. P2C | Avg. IXP |
|---|---|---|---|---|
| Neighbor AS | Tier-1 | 1.206 | 0.888 | 0.867 |
| Transit | 2.108 | 4.135 | 5.181 | |
| Stub | 3.521 | 3.101 | 1.363 | |
| Non-Neighbor AS | Tier-1 | 1.597 | 1.252 | 1.069 |
| Transit | 2.443 | 4.583 | 5.698 | |
| Stub | 5.160 | 4.961 | 1.982 |
The Table above details the average number of new connections (P2P, P2C, and IXP) formed in Tier-1, Transit, and Stub ASes due to poisoning neighboring and non-neighboring ASes. Poisoning a neighbor AS shows a notable increase in new connections for Transit and Stub ASes, especially in the P2C and IXP categories, with Transit ASes peaking at 5.181 for IXP connections. In comparison, poisoning non-neighbor ASes generally leads to a higher increase in new connections across all types, with Stub ASes showing a significant rise in both P2P (5.160) and P2C (4.961) connections. Poisoning a non-neighboring AS results in the revelation of most connections, with most P2P being observed by Stub ASes, most P2C also being observed by Stub ASes, and most AS-IXP connections being observed by Transit ASes.
Observability across ASes
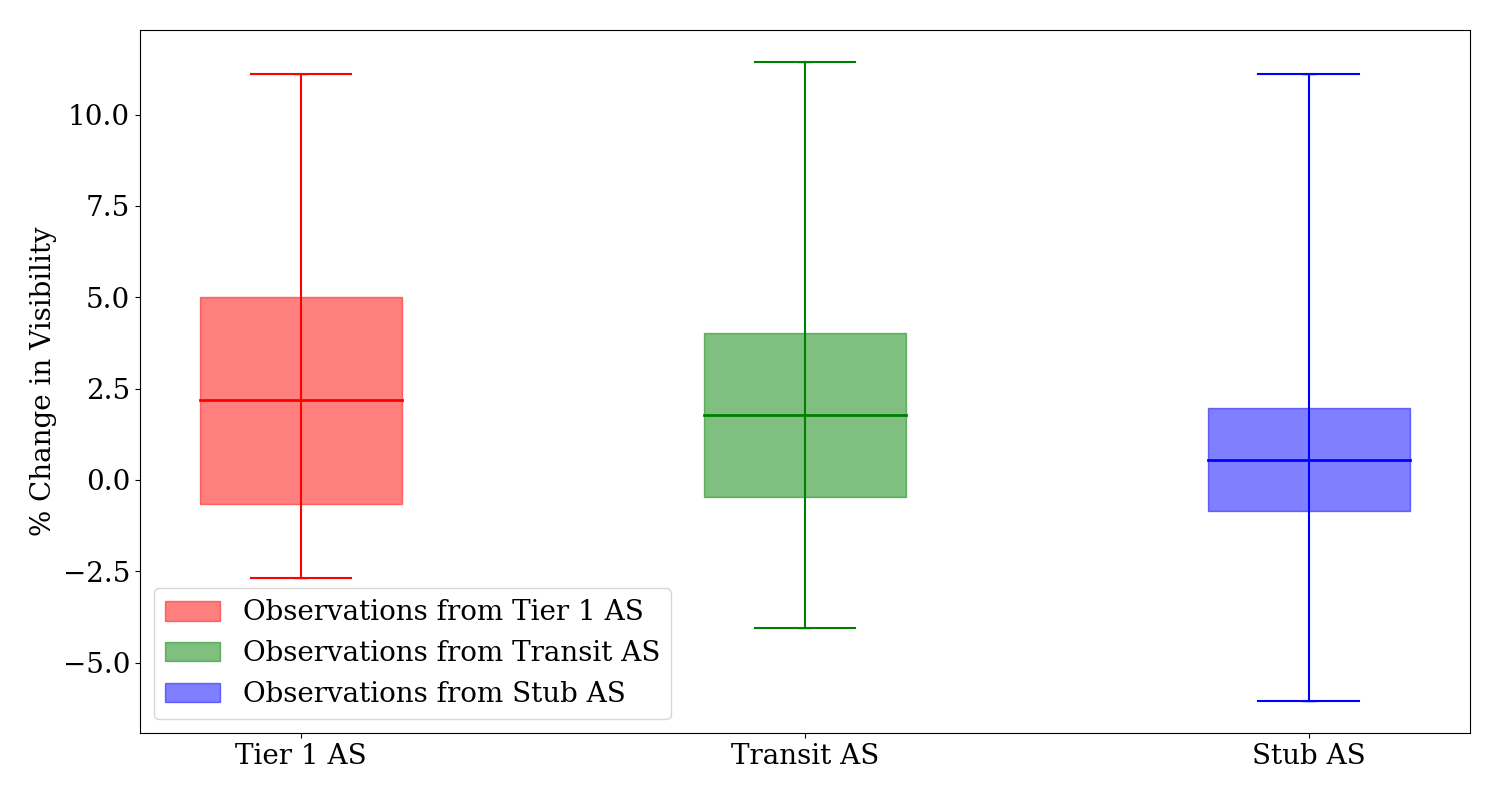 Avg. % change in network visibility observed across ASes
The Figure above presents the average percentage change in network visibility from Tier-1, Transit, and Stub ASes. The data reveals that Tier-1 ASes experienced a mean visibility change of 2.18%, Transit ASes had 1.78%, and Stub ASes showed the most minor change at 0.55%. These variations highlight the differential impact of network events on visibility, with Tier-1 ASes exhibiting the most significant fluctuations, as indicated by a maximum change of 11.11%. Therefore, Tier-1 AS observed the most change in visibility across all ASes.
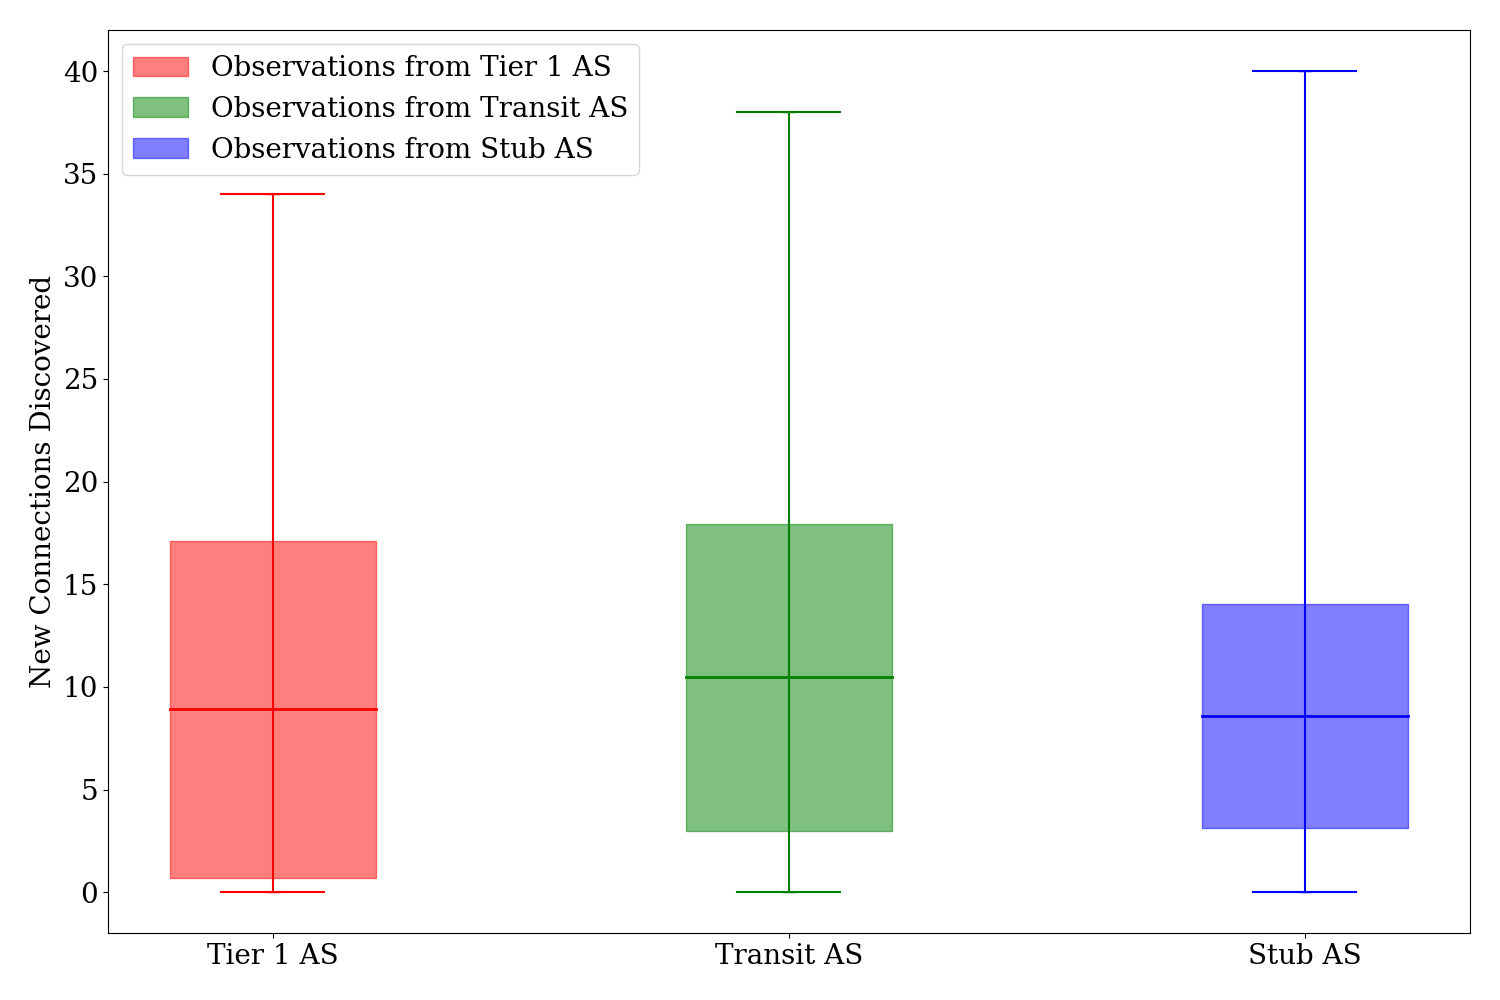 # of new connections observed across ASes
The Figure above illustrates the average number of new connections observed across Tier-1, Transit, and Stub ASes. Tier-1 ASes showed an average of 8.90 new connections, Transit ASes had a higher average of 10.46, and Stub ASes exhibited 8.58 new connections. The maximum number of new connections reached 40 for Stub ASes. Transit ASes discovered the most new connections across all ASes.
Observability across Neighboring ASes
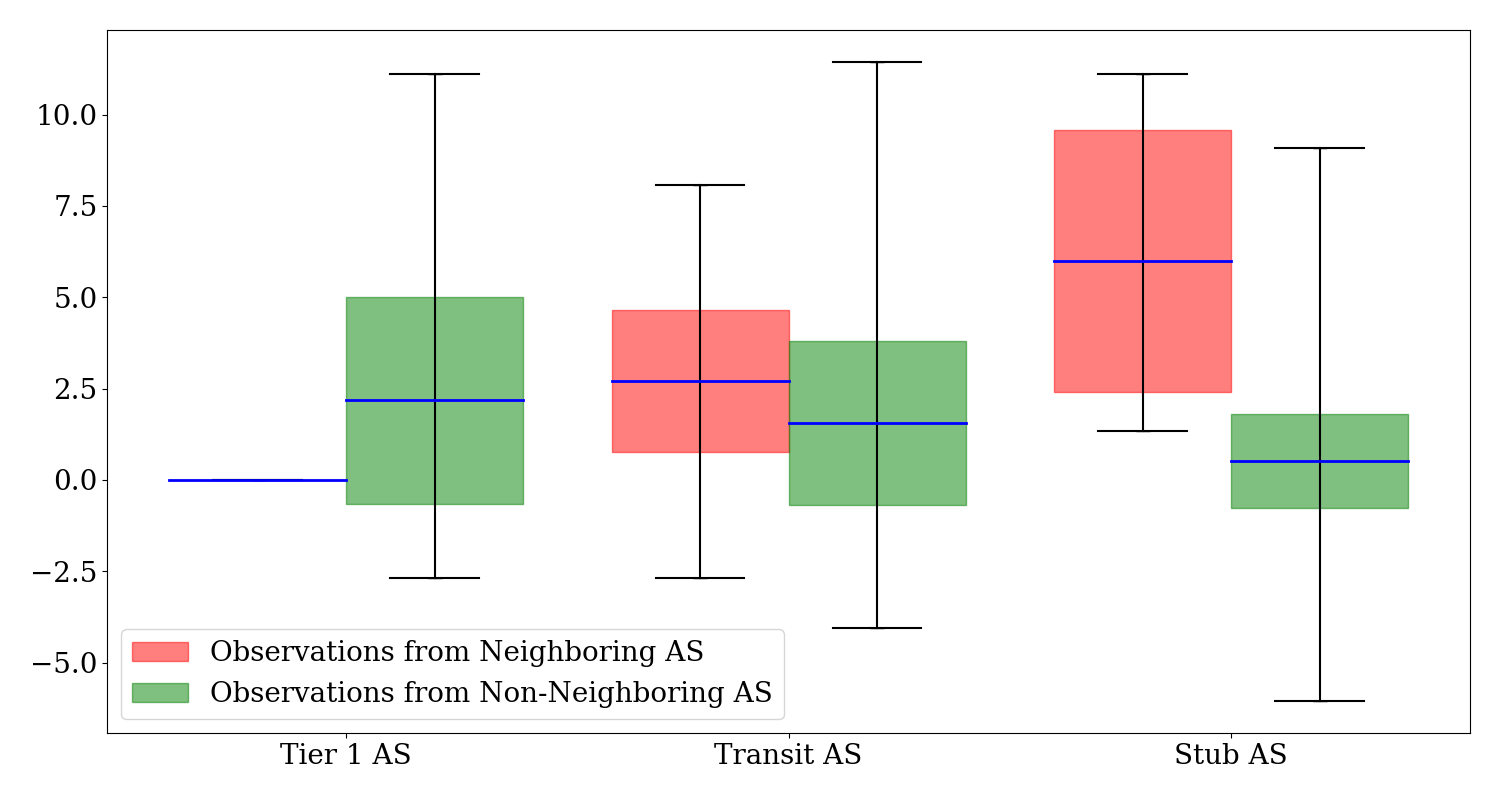 Avg. % change in Visibility Observed Across Neighboring and Non-Neighboring ASes
The Figure above illustrates the average percentage change in visibility for neighboring and non-neighboring ASes, highlighting a stark contrast in the impact on visibility. While specific data for Tier-1 ASes as neighbors are unavailable since the observed Stub ASes did not have any Tier-1 ASes as neighbors, Transit and Stub ASes show significant changes, with an average increase of 2.71% and 6.00%, respectively, for neighbors. This is markedly higher than non-neighbors, where the average changes for Transit and Stub ASes are lower at 1.57% and 0.51%, respectively. Neighboring ASes observed a significantly higher change in the visibility of the topology than non-neighboring ASes.
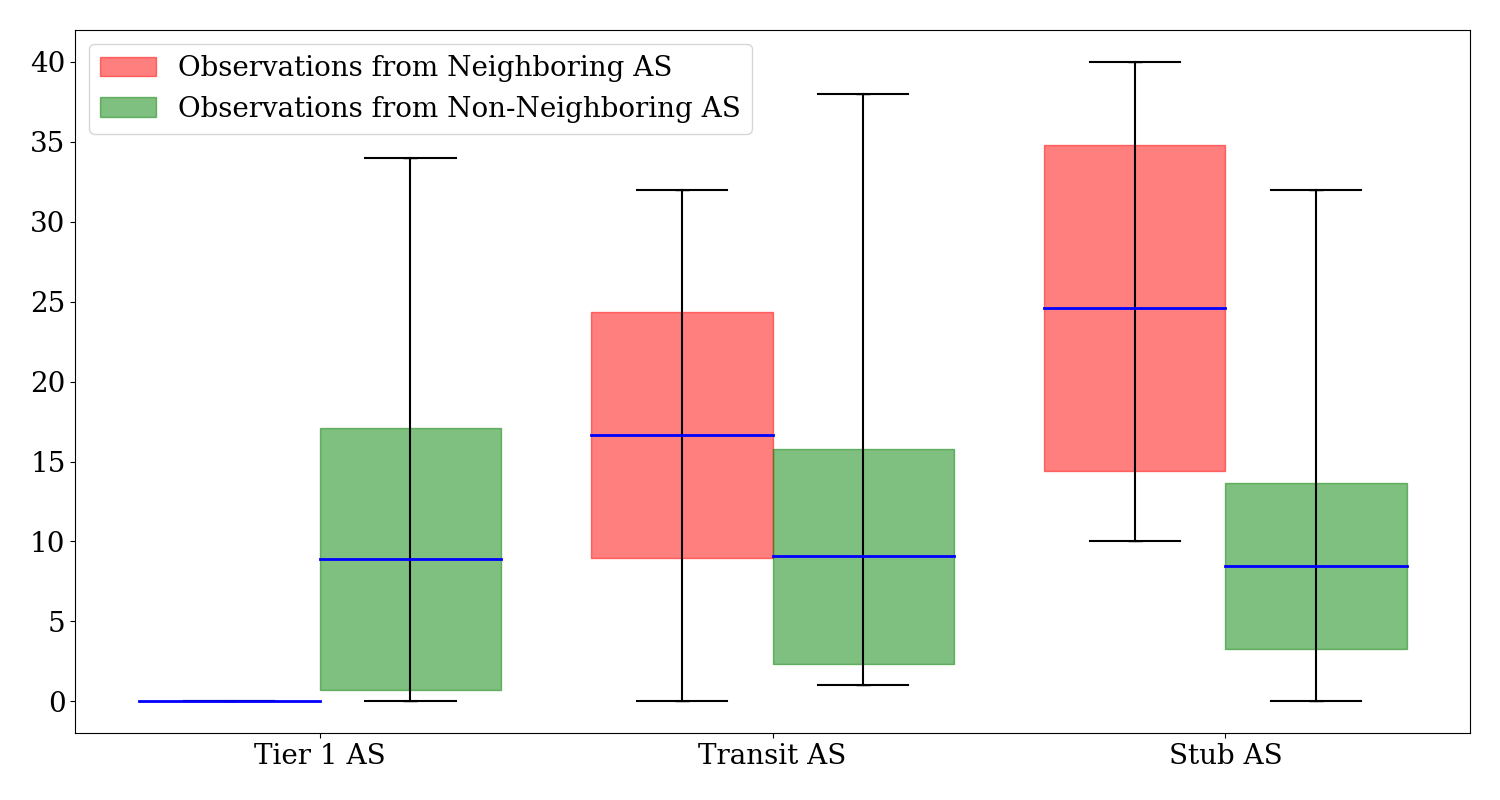 # of new connections Observed Across Neighboring and Non-Neighboring ASes
The Figure above shows the average number of new connections observed across neighboring and non-neighboring ASes. The data reveals a pronounced disparity, especially for Stub ASes in the neighbor category, with an impressive mean of 24.60 new connections and a high of 40 connections. In comparison, non-neighbors exhibit more uniform numbers, with Tier-1, Transit, and Stub ASes having means of 8.90, 9.08, and 8.45, respectively. Neighboring ASes observed a significantly higher number of new connections than non-neighboring ASes.
Discussion
Analysis of Results
Baseline Visibility
The baseline visibility results of the topology show that the Tier-1 ASes have a limited view of the IXP connections. In contrast, Transit and Stub ASes have broader visibility across connection types (P2P, P2C, and IXP). Stub ASes exhibit the most diverse visibility, observing more IXP connections than Tier-1 or Transit ASes. However, regarding direct P2P and P2C connections, Stub ASes have the lowest visibility, followed by Transit ASes, with Tier-1 having the most visibility across the topology. This aligns with our understanding of the Internet, where the Tier-1 ASes have a birds-eye view of the topology, mainly comprising P2C connections.
BGP Poisoning Impact
Although the average change in visibility is only slightly higher due to several connections being no longer available and alternate connections taking their place, the average number of new connections discovered per AS is 8.847 in a 297 connection topology.
- Tier-1 and Transit Poisoning: Poisoning Tier-1 or Transit ASes affects the topology differently. Tier-1 poisoning causes more substantial visibility changes across AS categories. However, the new connections discovered post-poisoning also vary, with Transit ASes often finding more new connections than Tier-1 and Stub ASes. The visibility and new connections remain unchanged across stub ASes regardless of whether Tier-1 or Transit AS was poisoned.
- Neighboring AS Poisoning: Poisoning neighboring ASes results in significantly lower visibility changes than poisoning non-neighboring ASes. However, new connections discovered post-poisoning of neighboring ASes indicate a higher potential for network changes and adaptation in the local vicinity, especially for Stub ASes.
- Other Impact: Another significant impact of BGP poisoning is observed when the poisoning AS has more than one provider. When poisoning a Tier-1 or a Transit AS, the neighboring provider ASes change their traffic to forward through the poisoning AS. This could occur where they find sending their traffic through the customer optimal since it advertises a connection with a provider/peer. In these situations, the fundamental property of BGP, valley-free routing, gets challenged.
Observability of Poisoning
The observability of network changes through poisoning from different AS types highlights that Tier-1 ASes experience significant visibility changes; this lines up with the baseline visibility, confirming their pivotal role in network perception. Additionally, the observability of new connections indicates that Transit ASes, on average, observe more changes than Tier-1 and Stub ASes, confirming their role in an intermediary network position within the topology hierarchy. Stub ASes have the lowest average number of new connections discovered. However, they have the highest range, indicating the potential for discovering significantly more connections if they poison a pivotal AS. The observations from neighboring ASes show the most impact on Stub ASes. This further reinforces the notion that network proximity significantly influences the extent of visibility changes and new connections, with neighboring relationships intensifying the network’s response to disruptions.
Maximizing the effectiveness of BGP poisoning
To maximize the effectiveness of BGP poisoning through a Stub AS, we need to consider optimizing the number of new connections rather than changing visibility. While the change in visibility reflects the shifts in routing paths, new connections indicate insights into the network’s depth and previously undiscovered connectivity. Considering that the topology would revert to its original state after poisoning, we need to be able to get the most connections with our BGP poisoning.
The discussion synthesizes the results to provide strategic insights into the effective use of BGP poisoning and the observable effects on network topology.
To maximize the effectiveness of BGP poisoning through a Stub AS, we can use the inferences from the results and make the following decisions:
- Choosing which AS to conduct Poisoning: When deciding which AS should perform poisoning to maximize the effectiveness, we can observe that the most influential cases involved Stub ASes that were well connected in the topology. This means having multiple providers and connecting with other Stub/Transit ASes. Well-connected AS will significantly impact the topology and contain several potential paths from which it can receive traffic.
- Choosing which AS to Poison: Poisoning Tier-1 ASes results in more connections being discovered within Transit ASes. Poisoning Transit ASes results in finding the most new connections overall, especially among Tier-1 ASes. This suggests that poisoning Transit ASes more effectively reveals new connections across different ASes. This could be due to the intermediary role that Transit ASes play in the topology, and poisoning them could reveal new pathways that were not utilized before. Moreover, when targeting Transit ASes, choosing non-neighboring Transit ASes led to more substantial benefits in terms of network visibility and new connection opportunities.
- Choosing which AS to observe Poisoning: Transit AS are the most effective in discovering AS connections through BGP poisoning. Additionally, neighboring ASes observed significantly more new connections after BGP poisoning than non-neighboring ASes, with the disparity being most pronounced in Stub ASes among the neighbors. As the extreme case studies showed, ASes with more interdependence through standard providers and indirect paths had higher visibility than isolated ASes.
Minimizing the impact of BGP poisoning
Community
BGP Poisoning is a valid engineering technique described in the BGP RFC(4271). However, given its nature of propagating paths that do not exist and these paths being advertised on the Internet, BGP poisoning is often restricted for research and isolated prefixes. Smith et al., during their study interacting with other ASes on the Internet, noted receiving four emails from neighboring ASes who mistook the poisoning for router error.
These could be mitigated by communicating with neighboring ASes to inform them of the planned activity. Communication would include the purpose and duration of the poisoning, which would prevent misunderstanding and misinterpretation of the poisoned routes as network errors.
Impact on the network
Technical limitations exist for BGP poisoning and its impact on the bandwidth. Conducting poisoning that advertises long paths could lead to re-routed traffic taking longer to reach its destination, impacting regular traffic. Smith et al. observed that they did not exceed 10 MB/s at peak during their experiments. While modern routers are capable of handling this level of disruption, the impact can be minimized further by selective BGP poisoning, restricting BGP poisoning to only poison a few ASes at once, ensuring a short path, limiting the scope of poisoning to only include ASes that would have the most impact on the AS performing the BGP poisoning, and selectively poisoning ASes through specific neighbors.
BGP Convergence and Route-flap dampening
BGP convergence is the time it takes for an AS to settle on an available path after it receives path advertisements from its routers. Earlier works, like Colitti’s, considered convergence times a significant limitation for active BGP probing. Their studies indicated a roughly 15-minute interval before the path converged. However, the BGP RFC(4271) recommends a 30-second interval for convergence.
In their research, Katz Bassett et al. proposed minimizing disruptions by ‘preparing’ the neighboring ASes for the poisoning. Rather than initially advertising a baseline path of {1} before poisoning, AS1 could instead advertise a baseline path of {1,1,1}. This would ensure that the AS path length stays consistent before and during poisoning, speeding up convergence. In their experiments, they observed that up to 94% of the routing advertisements in their study converged instantly using this method.
Route-flap dampening is another limitation of BGP poisoning. This method prevents the propagation of unstable routes, which can be caused by router instability or misconfiguration; however, it also impacts BGP poisoning. Colitti considered spacing out their probes to less than one every hour to bypass this issue. Recent works like Pessler et al. have discovered that Route-flap dampening is no longer widely deployed. Additionally, the BGP RFC recommends making it less restrictive.
Benefits of BGP Poisoning
There are several benefits of using BGP poisoning for topology discovery:
- Real-time Data: BGP poisoning can provide network operators with up-to-date information about the network topology. Unlike static databases, which may have outdated information, BGP poisoning offers a current view of the network paths and connections.
- External Databases and Looking Glass Servers: BGP poisoning eliminates the need to access external databases and repositories such as RouteViews and RIPE NCC. This allows network operators to discover network topology directly.
- Compatibility: BGP poisoning relies solely on BGP’s inherent property to avoid loops. Therefore, it is compatible with the current implementation of ASes without requiring network-wide protocol updates or architectural changes.
- Network Insights: BGP poisoning and active BGP probing reveal hidden aspects of the network topology, such as path preferences, route propagation, and the influence of specific AS paths on routing decisions. This differs from other topology discovery techniques, such as IP probing and BGP routing data collection, which can only gather actively used routes.
Game Theory of BGP Poisoning
We can conduct a game theory assessment to better understand the implications of BGP poisoning for topology discovery.
Players
Players would be pairs of ASes connected to the Internet and participating in BGP routing. One AS would initiate the BGP Poisoning, while the other would collect the routing changes and identify hidden connections and links. The other player would be the other ASes in the same topology as the pair. Their actions directly influence each other’s actions.
Strategies
Each player has two available strategies:
- Engage (E): They can use BGP poisoning to gain information about the hidden links within a network topology.
- Avoid (A): They can avoid BGP poisoning altogether to maintain optimal network performance and avoid potential negative impacts.
Payoffs
The benefits of conducting BGP Poisoning would include improved network knowledge and future performance enhancements, while costs could involve network disruptions, increased latency, and negative peer perception.
We can create a hypothetical payoff matrix as follows:
| Other AS Pair Engage | Other AS Pair Avoid | |
|---|---|---|
| AS Pair Engage | (E,E) | (E,A) |
| AS Pair Avoid | (A,E) | (A,A) |
- (E, E): If both pairs engage in BGP poisoning, they will gain network insights but may suffer from performance issues. The longer BGP paths and excessive routing would lead to large amounts of traffic going through paths that do not support it. This might also impact visibility since most of the paths would be avoided.
- (E, A): If one pair avoids while the other engages in BGP poisoning, the pair that engages in BGP poisoning would gain significant network insights at the potential disruption post. The second pair would also see some network insights due to the poisoning but will not incur substantial disruptions.
- (A, E): If one pair avoids BGP poisoning while the other pair engages in it, the pair that engages in BGP poisoning would gain significant network insights at the potential disruption post. The second pair would also see some network insights due to the poisoning but will not incur substantial disruptions.
- (A, A): If both pairs avoid BGP poisoning. They will not gain any network insights while maintaining network performance.
Analysis
This scenario has no clear dominant strategy for either player. A Nash Equilibrium might exist depending on the context.
If performance and stability are valued, the disruption caused by BGP poisoning would not be justified by the information gained through BGP poisoning. Therefore, both pairs might choose to Avoid (A) to maintain network stability, even though they gain no additional knowledge. This could lead to a situation where a more optimal path might exist, but they continue with their available paths without the necessary expertise.
If knowledge is valued, the knowledge gained from BGP poisoning will compensate for the loss in performance and stability. Therefore, both pairs might Engage (E) to gain insights despite potential disruptions. However, if the hidden links are not significant enough, everyone could experience disruptions without much benefit.
Additionally, other factors could also influence the decision made by an AS. These include the frequency of BGP poisoning, where if an AS frequently conducts poisoning, neighboring ASes that do not want their paths revealed might choose to un-link or restrict the traffic from that AS.
Future Work
The scope of our study has limitations, and with additional time and resources, further refinement of the topology generation algorithm, simulation environment, and poisoning techniques could be explored.
Impact of CDNs
Content Delivery Networks (CDNs) have drastically changed how Internet traffic is shared. Rather than having servers positioned worldwide, CDNs provide localized data centers that prevent traffic from traveling across long paths spanning several ASes. Future research should investigate how BGP poisoning affects CDNs’ operational efficiencies and traffic management. By analyzing CDN-specific routing behaviors and the interaction between CDN nodes and ASes during BGP poisoning, we can better understand the CDN’s role in the global internet topology and its resilience to routing manipulations.
Advanced Topology Generation
The topology generation used within this research was built based on random seeds and a range of connections estimated to represent the real Internet. Subsequent research should focus on developing a more sophisticated topology generation algorithm to enhance the accuracy of our simulations. This entails a detailed analysis of real-world AS behavior, incorporating factors such as geographic distribution and economic considerations, and an informed understanding of the range of P2P and P2C connections for various ASes. By integrating these factors, we can create a more realistic and complex simulation environment that better mirrors the intricacies of the real Internet.
Evaluation of the Real Internet
Although our research is performed on a simulation, we attempted to make it as representative of the real Internet as possible. Future work should include live BGP poisoning experiments on the real Internet, under controlled and ethical conditions, to observe the direct effects and uncover the hidden links between ASes. These studies would validate our simulation results and help us understand the practical challenges and implications of BGP poisoning in a real-world context.
Conclusion
Through our research, we demonstrated the potential of BGP poisoning to discover AS-level topology, revealing hidden P2C and P2P connections. By developing a sophisticated simulation environment and implementing BGP poisoning, we have provided new insights into the dynamics of Internet routing, highlighting the complexities and the underlying mechanisms that govern AS-level connections.
Our conclusions draw from both simulated results and theoretical analysis, aiming to enhance practical network management and security strategies.
Our contributions to cybersecurity and network management include a novel topology generation algorithm capable of designing a topology consisting of three types of ASes, IXPs, and both P2P and P2C connections, making it representative of the real Internet; implementation of Holterbach et al.’s Mini-Internet simulation; and strategic implementations of BGP poisoning that balance discovery with network stability.
We discovered that our simulation could closely represent the complex behaviors of the real Internet, with Tier-1 ASes having limited visibility into IXP connections while having the best visibility into P2C connections throughout the topology. Conducting BGP poisoning on Tier-1 or Transit ASes leads to significant visibility changes for all ASes on the network, with Transit ASes discovering more new connections than Tier-1 or Stub ASes. This effect is less pronounced when a neighboring AS is poisoned. Effective poisoning involves selecting well-connected Stub ASes and targeting a non-neighboring Transit AS to maximize new connections. The most benefit can be observed by observing this poisoning from a neighboring Transit AS. Additionally, the impact of poisoning can be mitigated through communication with neighboring ASes, selective poisoning, and ‘preparing’ BGP for poisoning.
Our research underscores the significance of innovative approaches like BGP poisoning in enhancing the accuracy and depth of AS-level topology mapping. By advancing these techniques, we create a more resilient, efficient, and secure Internet infrastructure.
Acknowledgement
I thank my advisors, Prof. HB Acharya, and Prof. Sumita Mishra, for guiding and supporting me throughout this project. I am also grateful to Thomas Holterbach, Tobias Bühler, and Laurent Vanbever for their Mini-Internet Simulation tool, which was pivotal in this study. I also thank the Rochester Institute of Technology for providing me with the resources to conduct the experiments required for this research.
You can access the project by clicking here, and you can access the code here.
References
- Oliveira et al. - The (in) completeness of the observed internet as-level structure
- Colitti et al. - Active bgp probing
- Holterbach et al. - An open platform to teach how the internet practically works
- Subramanian et al. - Characterizing the internet hierarchy from multiple vantage points
- L. Gao - On inferring autonomous system relationships in the internet
- Huffaker et al. - Topology discovery by active probing
- Chen et al. - Where the sidewalk ends: Extending the internet as graph using traceroutes from p2p users
- W. Xu and J. Rexford - Miro: Multi-path interdomain routing
- Jin et al. - Toposcope: Recover as relationships from fragmentary observations
- Peng et al. - Inferring multiple relationships between ases using graph convolutional network
- Colliti et al. - Investigating prefix propagation through active bgp probing
- Bush et al. - Internet optometry: assessing the broken glasses in internet reachability
- Anwar et al. - “Investigating interdomain routing policies in the wild
- Smith et al. - Withdrawing the bgp re-routing curtain: Understanding the security impact of bgp poisoning via real-world measurements
- Katz-Bassett et al. - Lifeguard: Practical repair of persistent route failures
- Medina et al. - Brite: Universal topology generation from a user’s perspective
- J. Winick and S. Jamin - Inet-3.0: Internet topology generator
- J. Tomasik and M. A. Weisser - ashiip: Autonomous generator of random internet like topologies with inter-domain hierarchy
- World ASN Statistics by Number - Regional Internet Registries Statistics
- Dimitropoulos et al. - As relationships: Inference and validation
- T. Benzel - The science of cyber security experimentation: the DETER project
- S. Helali - Simulating network architectures with gns3
- K. Olson - Eve-ng-bgp-lab-setup
- Rekhter et al. - Rfc 4271: A border gateway protocol 4 (bgp-4)
- Pessler et al. - Route flap damping made usable
